Figure 1: 3D Solid model from the metrology scan of the upper and lower casing halves. The joint of interest is highlighted in red.
By James Cardillo – Senior Structural Analyst and Nicholas Gregory – Design Engineer III
Recently, RMS received a repair order for a steam turbine casing that experienced significant leakage and erosion damage at the flange joint. Before developing a solution for the repair, RMS was tasked with identifying the root cause of the leakage failure. This required some extensive modeling and analysis tasks beyond the typical structural analysis scope at RMS. Adding to the challenge, no 3D CAD model of the existing casing was available. Therefore, a full metrology scan of the casing geometry was needed to kick off the modeling process. Figure 1 shows the resulting 3D model created from the metrology scan with the two casing halves and the flange joint highlighted in red. Figure 2 shows photographs of the flange faces with some of the erosion damage and internal fluid leakage paths annotated.
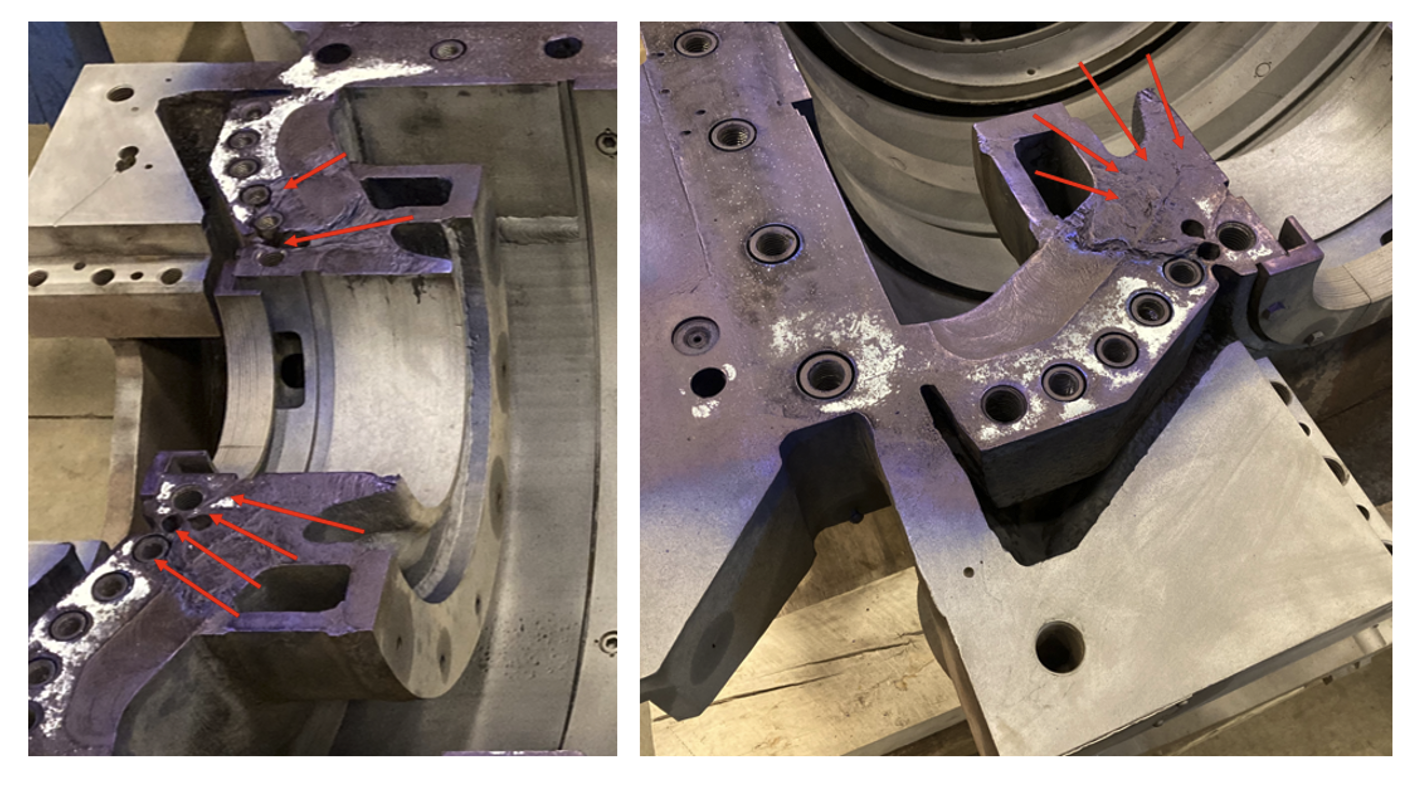
Figure 2: Photographs of some of the damaged areas at the flange. Estimated leakage paths are annotated with red arrows.
The analytical model of the casing presented several modeling challenges:
- The casing geometry was complex and could not be drastically reduced in scope if the physics were to be properly accounted for.
- The thermal expansion effects and internal pressure needed to be included in the analysis. The thermal expansion would have a significant impact on the contact pressure at the joint.
- The bolted joints needed to be modeled in an appropriate level of detail to account for the physics. Possible sub-modeling would be needed if the required detail of the bolts pushed beyond computational limitations.
To address these challenges, a “bulk model” of the entire casing assembly was created first with the mesh fidelity focused on the flange joint. Modeling the bolts in detail would prove to be too demanding on computational resources and would create impractical calculation times. Therefore, beam approximations would be used to model the bolt physics in the bulk model. The beam approximations needed to have appropriate flexibility to account for the bolt materials, they needed to include the pre-load clamping effects on the joint, and they needed to include thermal expansion effects as the joint heated up. As stated in item 2) above, thermal expansion would play a significant role in the behavior of the joint. In fact, the thermal expansion would end up being a key factor in modeling the joint behavior as a severe “thru-wall” temperature gradient was experienced during operation. Figure 3 below shows the steady-state thermal modeling of the casing temperature gradient. The internals of the casing would reach temperatures exceeding 500 F while the outside would be cooled to approximately 140 F and as low as 90 F depending on the location. This set the stage for some excessive inside-to-outside temperature gradients across the joint thickness (shown in Figure 4 along with the associated bolt beam temperatures).
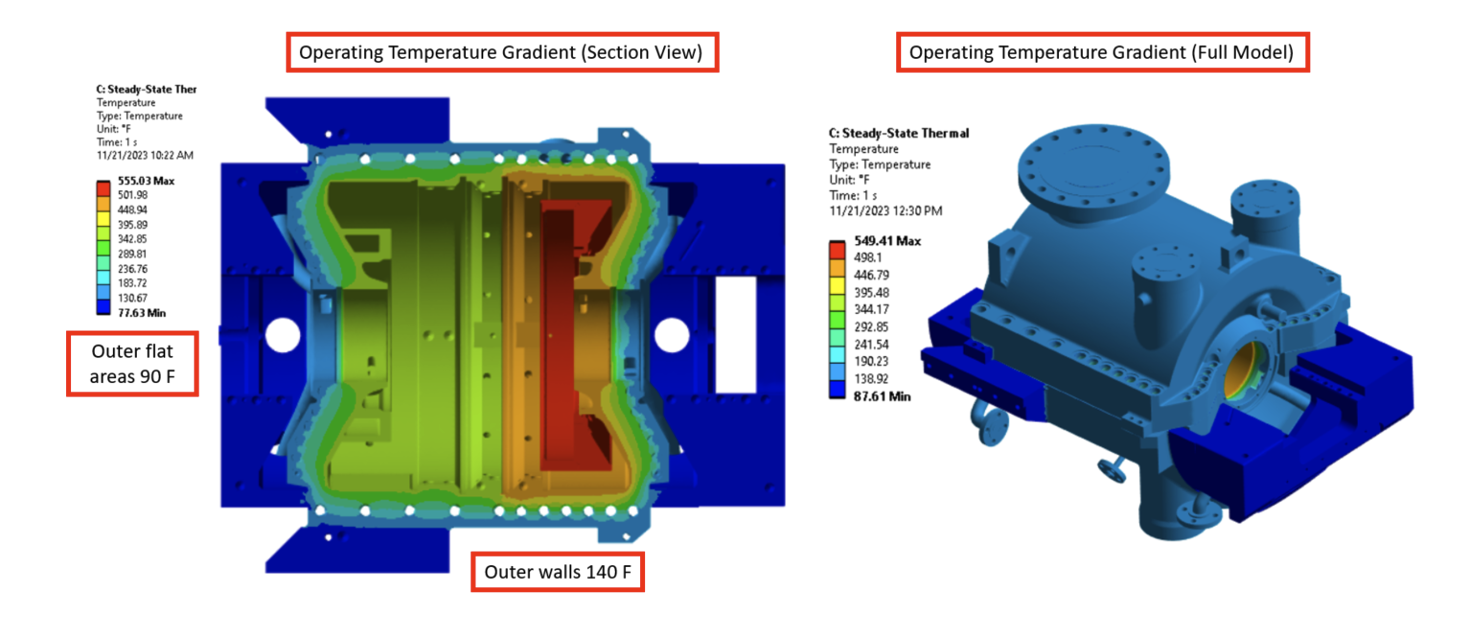
Figure 3: Steady-state thermal conduction modeling results of the casing temperatures. Inside temperatures reached as high as 550 F on the inlet side while the outside of the casing was cooled to approximately 140 F with the outer flat areas cooling further to 90 F.
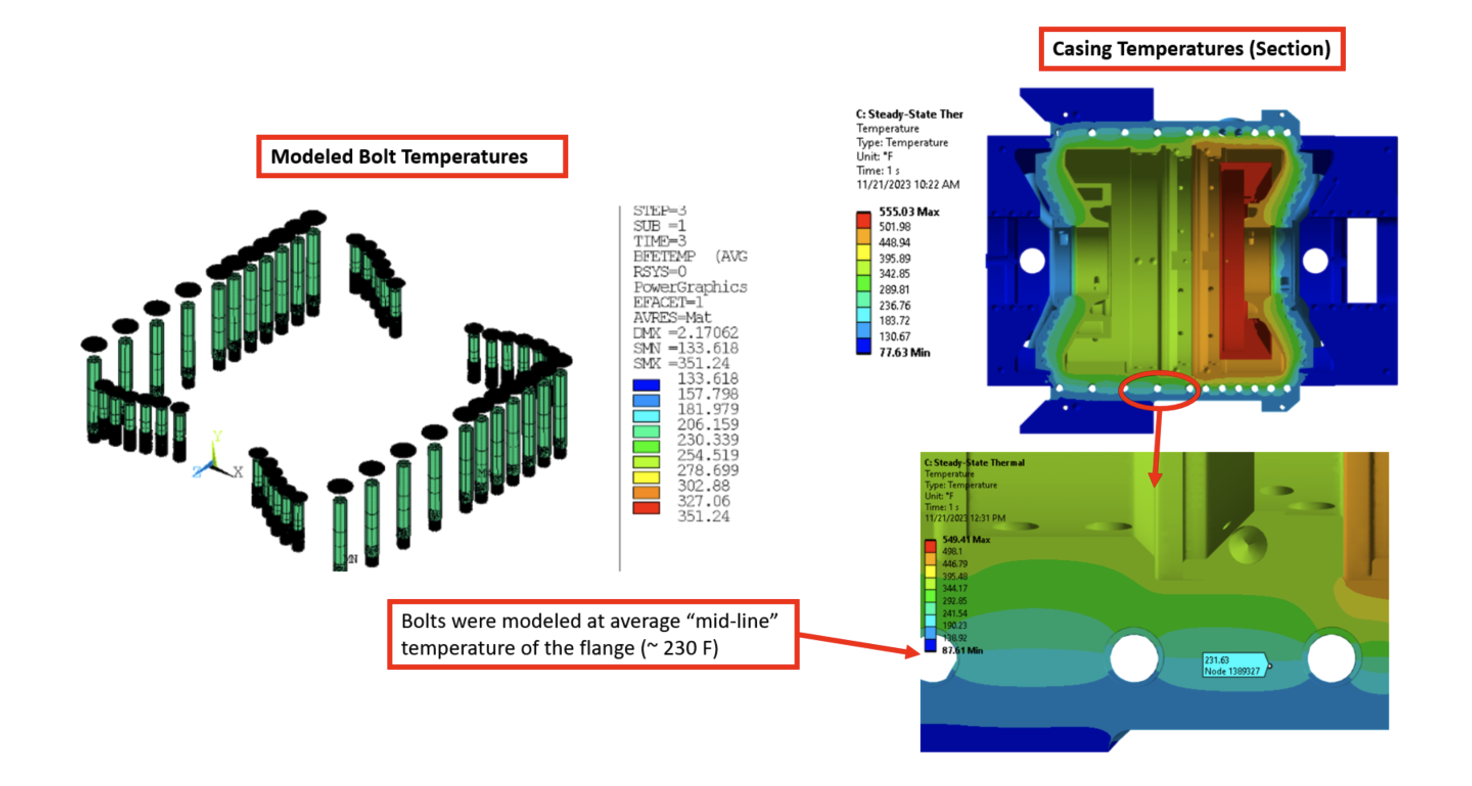
Figure 4: Steady-state thermal conduction modeling results showing the joint section zoomed (lower right). The applied beam bolt temperatures are shown in the left. The temperature gradient across the joint from inner-to-outer wall was significant as shown by the zoomed in view.
Also worth noting from the section views in Figures 3 and 4 above was the change in the flange bolt spacing as one moved from the inlet end (right side) to the discharge end (left side) of the casing. Towards the discharge end, the bolt spacing increased and less bolts were used. This was likely to account for the drop in pressure from the inlet to the discharge and thus less clamp force was needed at the discharge end. However, careful scrutiny and stress classification of the model would show that in spite of the pressure difference, the increase in bolt spacing would lead to inadequate contact pressure on the joint. Figure 5 shows a section view of the model across the flange taken with only the assembly torque effects included (pressure and temperature not yet added). As a general rule of thumb in bolted joint design, it is desirable to have the “pressure cones” (areas of joint material being compressed by the bolt-clamping force, see Figures 5 and 6 for clarification) from the neighboring bolts merge or “overlap” with one another to ensure uniform “clamping” of the entire joint. The section view shown in Figure 6 showed an early warning that when the bolts were spaced out, there was likely inadequate merging of the pressure cones in the joint. This issue would be further exacerbated by the introduction of internal pressure and temperature to the casing joint.
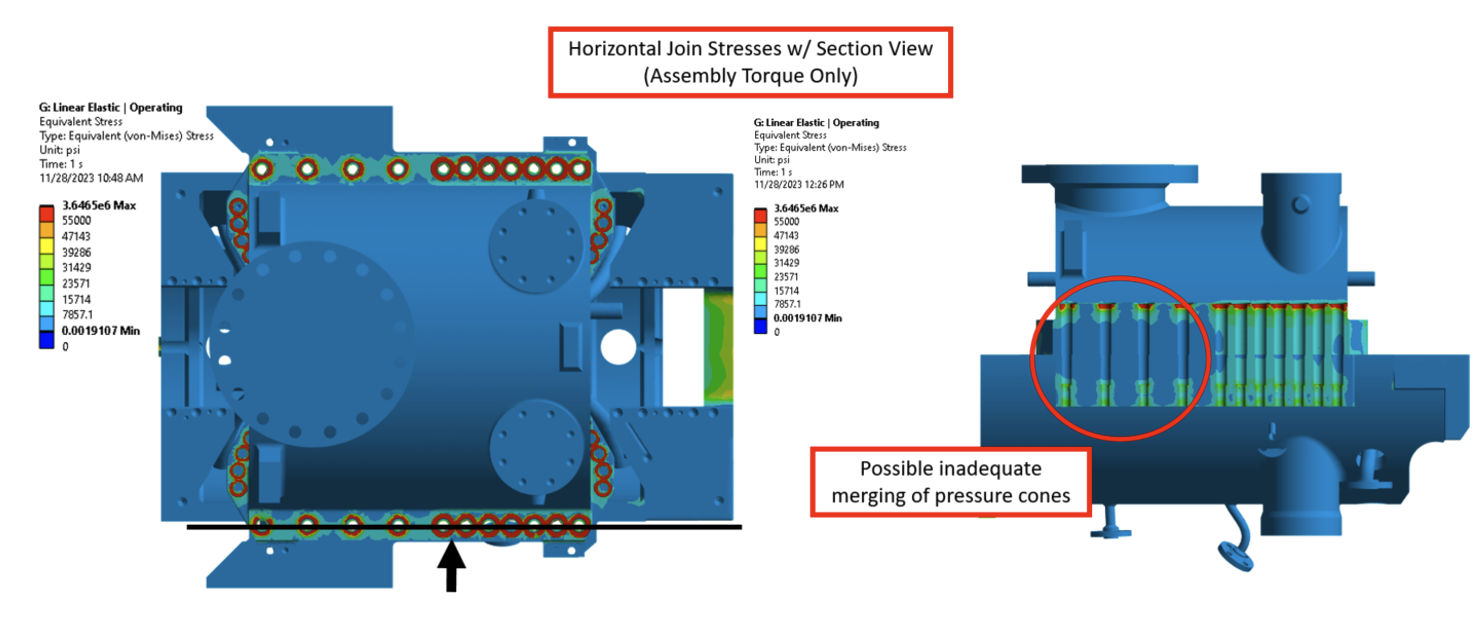
Figure 5: Stress section view of the joint showing the effects of assembly torque only.
Furthermore, In Figure 6, a section view is taken through the joint at the inlet end showing the minimum principal stress (areas of highest compression) during the assembly stage. Of particular interest was that the conical frustum of the bolt “apexes” or hits its highest extent and turns inward before the joint. A more favorable arrangement would be for the conical frustum to hit its apex closer to the joint separation line. In essence, the pressure cones were terminating too early. In practical terms, this signified that the bolt threads started too early and might benefit from starting deeper down into the lower flange hole to move the pressure cones downward towards the joint.

Figure 6: Stress section view showing the compressive stress on a single bolt at the inlet end of the casing. The Conical frustum is annotated showing early “apex” and termination of the pressure cone.
As mentioned before, all of these issues would be exacerbated with the addition of internal pressure and temperature. The status of the contact and the contact pressure along the faces of the joint are shown in Figures 7 and 8. Figure 7 shows the contact status and pressure with assembly torque only while Figure 8 shows the same views but with the addition of temperature and pressure. When temperature and pressure were added, it became obvious that a massive loss of contact pressure and the beginnings of joint separation ensued in certain areas due to differential thermal expansion occurring across the joint (yellow/orange areas in the status plots). Thus, the model exposed that areas of the joint were at high risk for leakage.
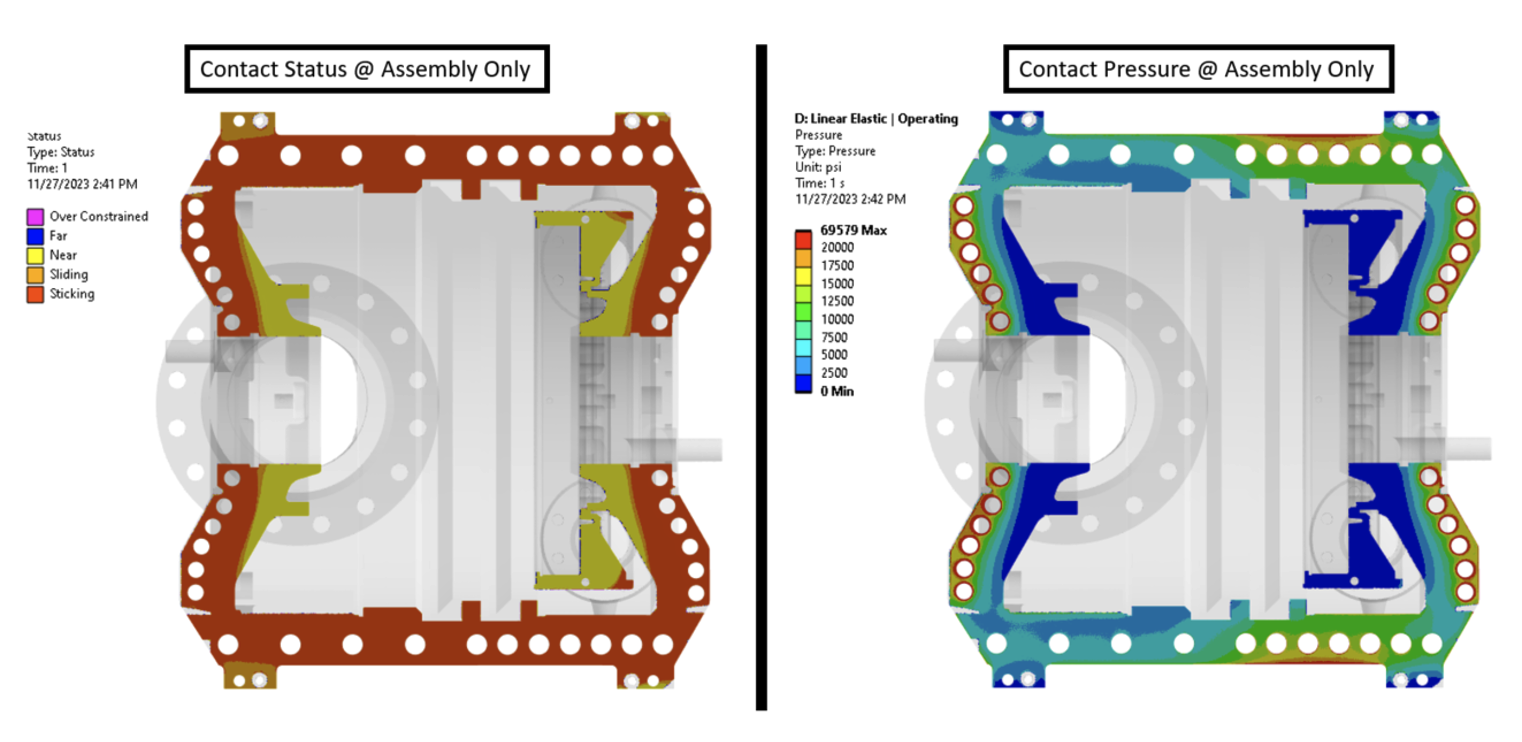
Figure 7: Contact status (left) and Contact pressure (right) at the joint faces during casing assembly. In the status plot, yellow areas signify areas where joint separation is occurring. Orange areas signify sliding areas (potentially at risk for losing contact). Red areas indicate areas in contact and “sticking” together.
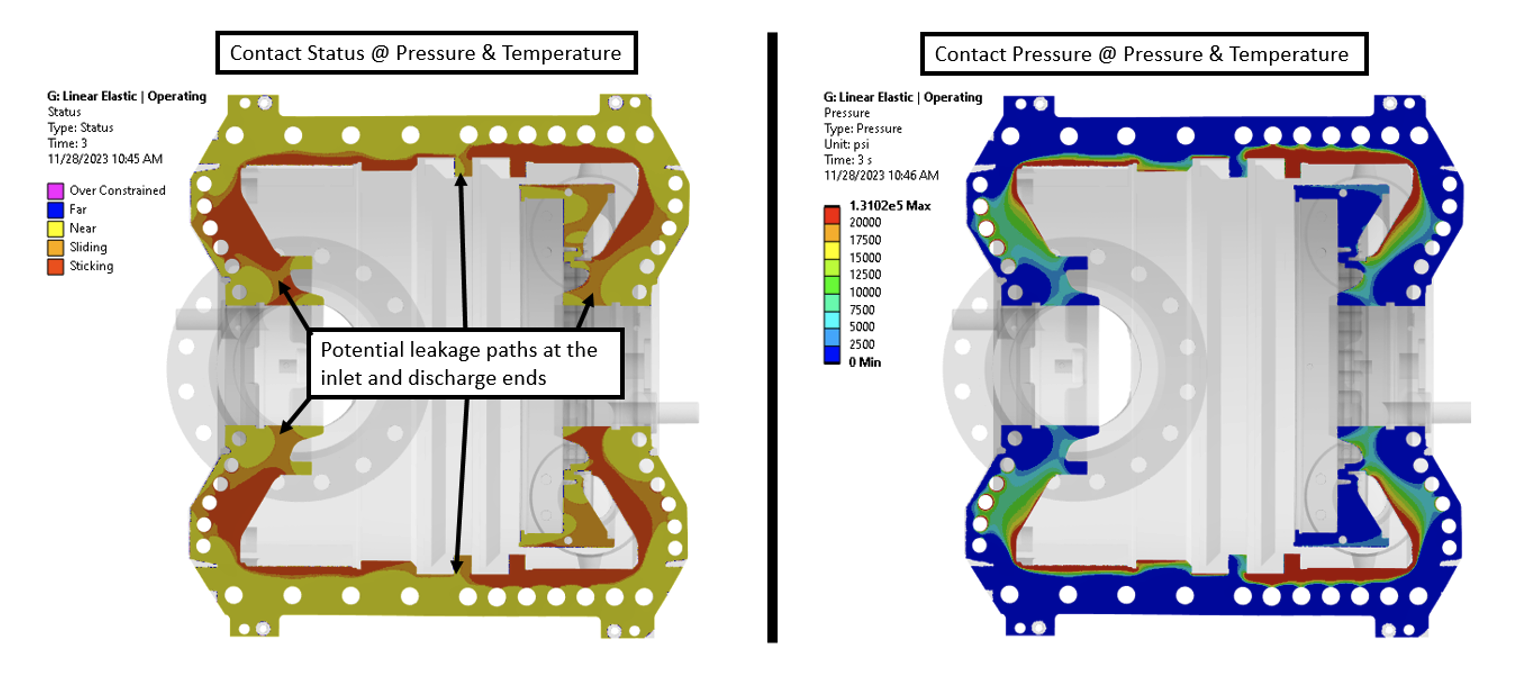
Figure 8: Contact status (left) and Contact pressure (right) at the joint at full operating conditions. In the status plot, yellow areas signify areas where joint separation is occurring. Orange areas signify sliding areas (potentially at risk for losing contact). Red areas indicate areas in contact and “sticking” together.
When modeling any type of phenomenon and trying to identify the potential root cause of a failure or issue, it is always a healthy exercise to interrogate the model and see how well it correlates to reality. Figures 9, 10, and 11 show some interesting views of “qualitative” correlation. On the left-hand side of these figures, actual photographs of the erosion and leakage paths are shown while on the right-hand side; the structural model contact status result is shown. Although not exact, there was some definite qualitative correlation showing loss of contact in the model very close to where erosion damage was observed on the actual casing.
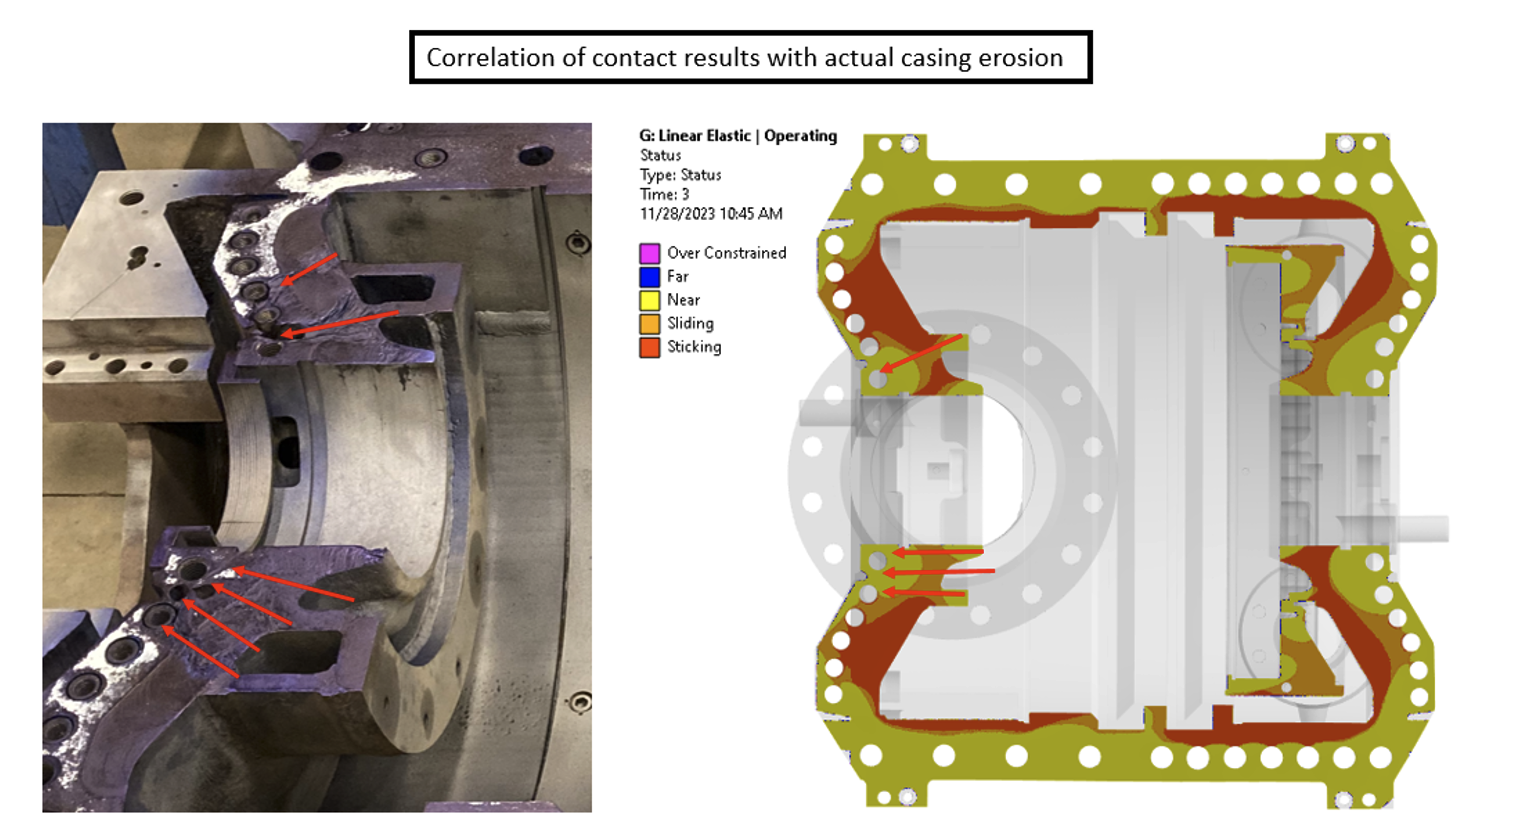
Figure 9: Photograph showing casing joint erosion damage with the leakage path annotated in red (left) and casing model contact status result with the leakage path annotated in red (right).
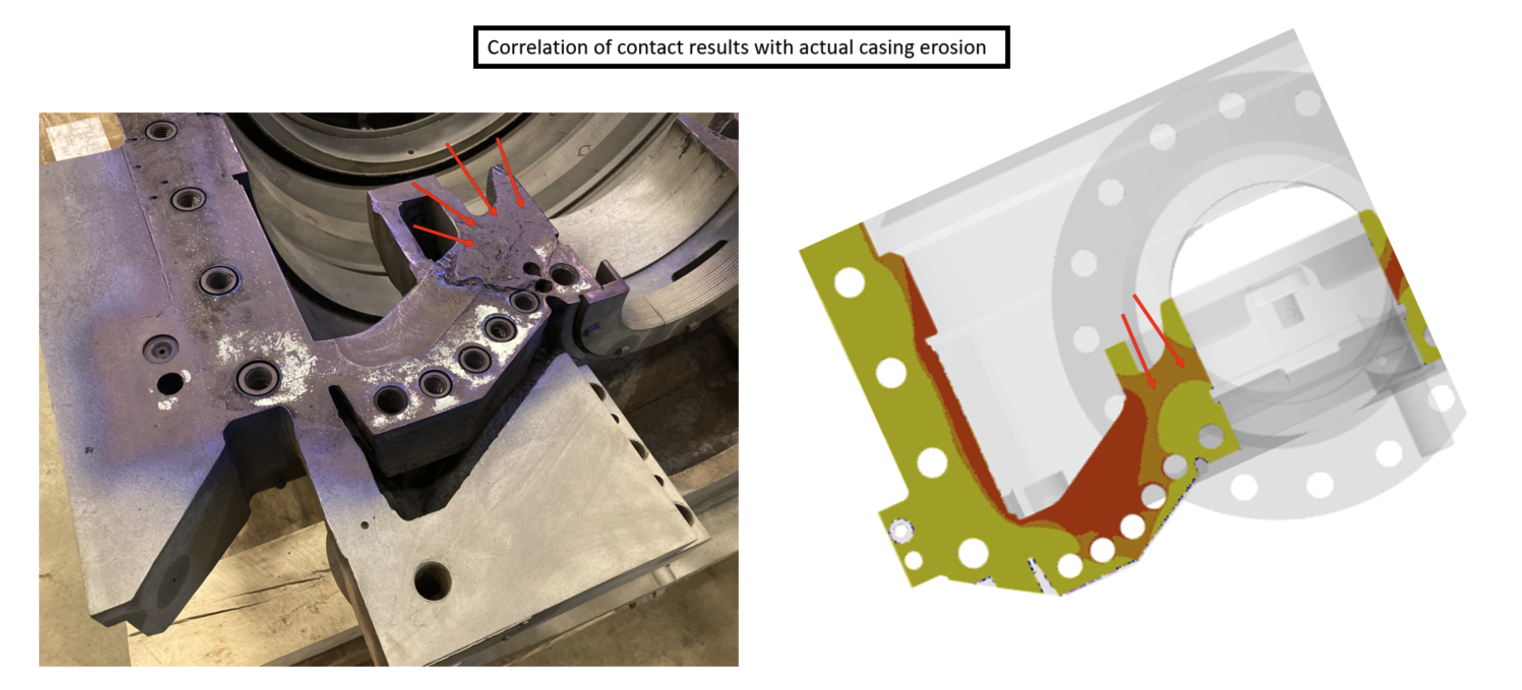
Figure 10: Photograph showing casing joint erosion damage with the leakage path annotated in red (left) and casing model contact status result with the leakage path annotated in red (right).
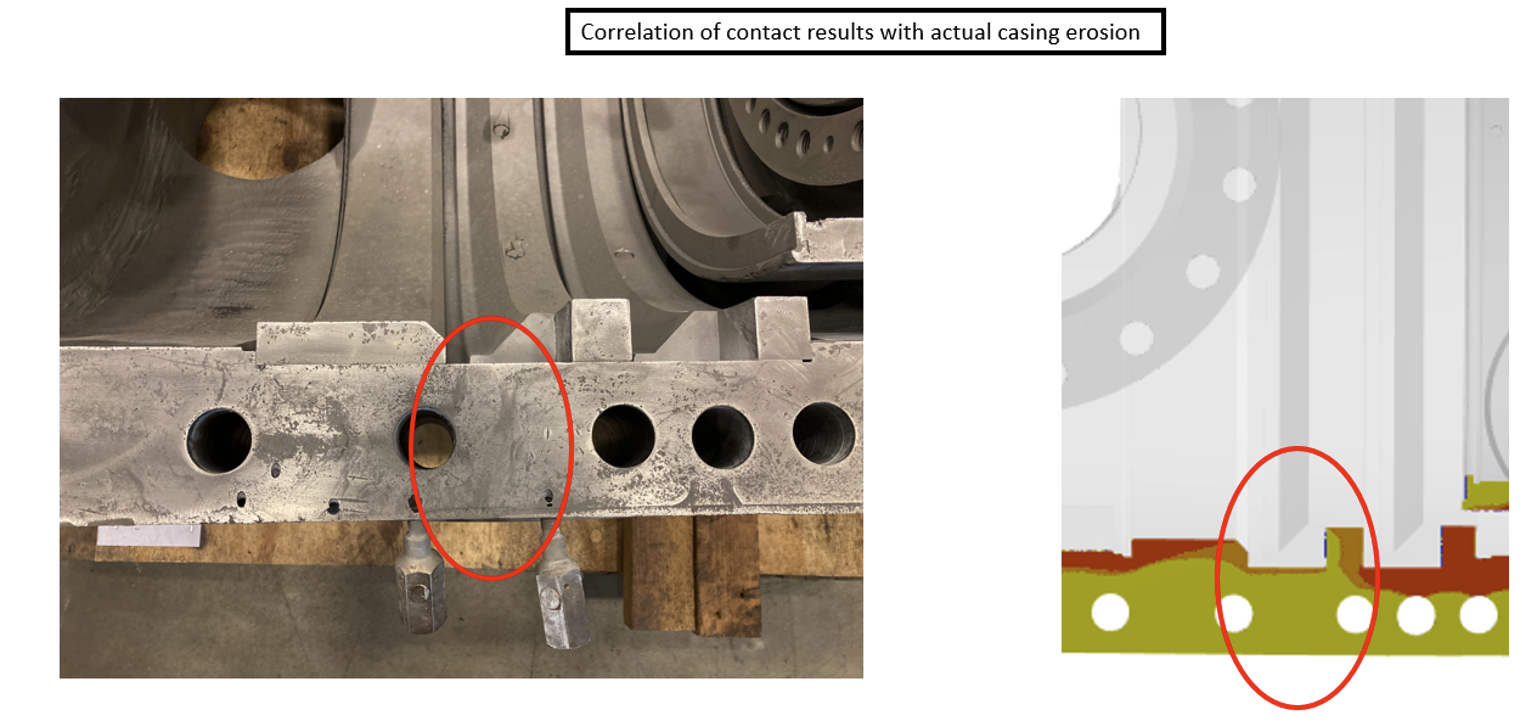
Figure 11: Photograph showing casing joint erosion damage with the leakage path circled in red (left) and casing model contact status result with the leakage path circled in red (right).
With the baseline analysis identifying several potential issues and showing decent correlation to the observed failures, the next step would be to use the analysis model to develop a design solution. The design solution would need to address several pitfalls in the original design:
- The bolt spacing at the discharge end was too sparse. The pressure cones from the bolts were not merging, allowing for leakage through the side of the casing.
- The temperature gradient through the thickness of the flange (inside to outside) was too extreme, allowing for differential thermal expansion and separation of the joint faces at temperature.
- The start of the thread on the casing bottom half at the inlet and discharge ends was shallow, causing the pressure cones to peak early before the actual joint. Thus, contact pressure was not optimized.
Several design and analysis iterations would be necessary to address each of the above pitfalls. To summarize the culmination of all the successful iterations and final design solution, the following changes were made:
- Bolts were added to the flange where the spacing was increased (See Figure 12).
- In addition to bolts being added, the bolt sizes and torques were increased slightly, allowing for a higher pre-load clamp force.
- The threads in the casing bottom half holes were shifted downwards drastically to move the pressure cone peaks down towards the joint separation line.
- An insulation jacket was added around the casing, thus reducing the extreme temperature gradient across the joint.
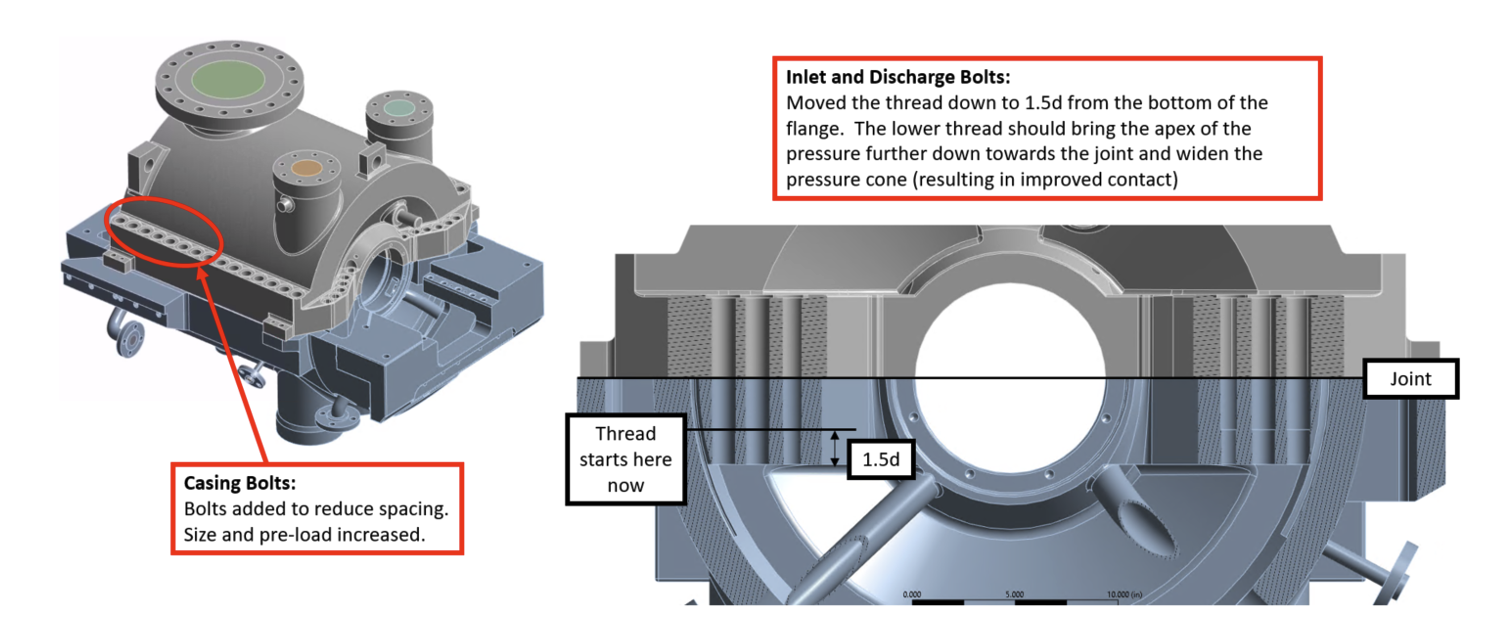
Figure 12: Summary of some design improvements
Figure 13 shows the results of items 1) and 2) above. Section views similar to Figure 5 at assembly torque are shown. On the left side of the figure, the baseline casing with no changes is shown. On the right side, the casing with the above design improvements is shown. Visual comparison of the stresses in the joint shows a clear improvement in the merging of the pressure cones between bolts as discussed earlier. There were no longer areas between the bolts where the material was not under compression.
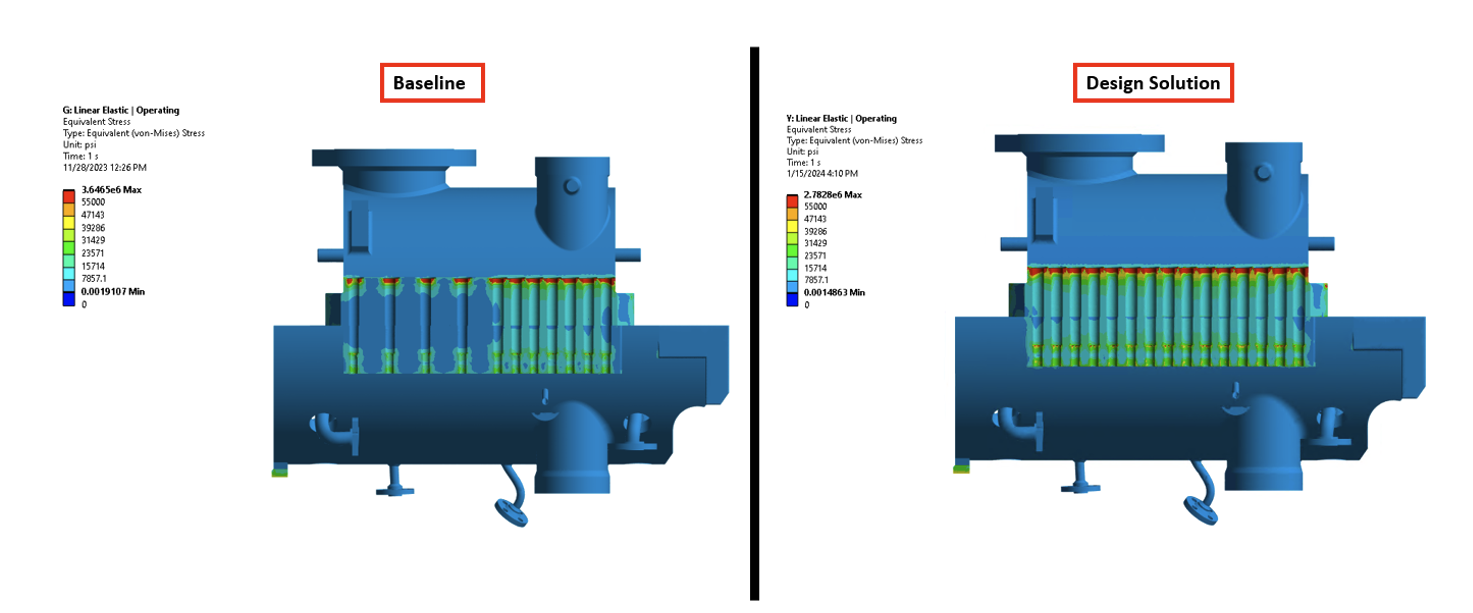
Figure 13: Section view through the flange joint showing the baseline stress results at assembly torque (left side) and the design solution stresses at assembly torque (right side).
In addition to items 1) and 2) above, the threads were shifted downwards at the inlet and discharge ends to move the pressure cones downwards towards the joint. This change was critical as the most significant loss of joint compression and subsequent leakage occurred at the inlet and discharge ends of the casing. Figure 14 shows a similar section view to Figure 6 with the design solution added to the right side for comparison. Once again, a clear improvement can be seen by comparing the compressive stress contours in Figure 14. In the design solution, the maximum point of the pressure cone occurred at the joint separation line, which established a wider and more uniform contact footprint at the joint.
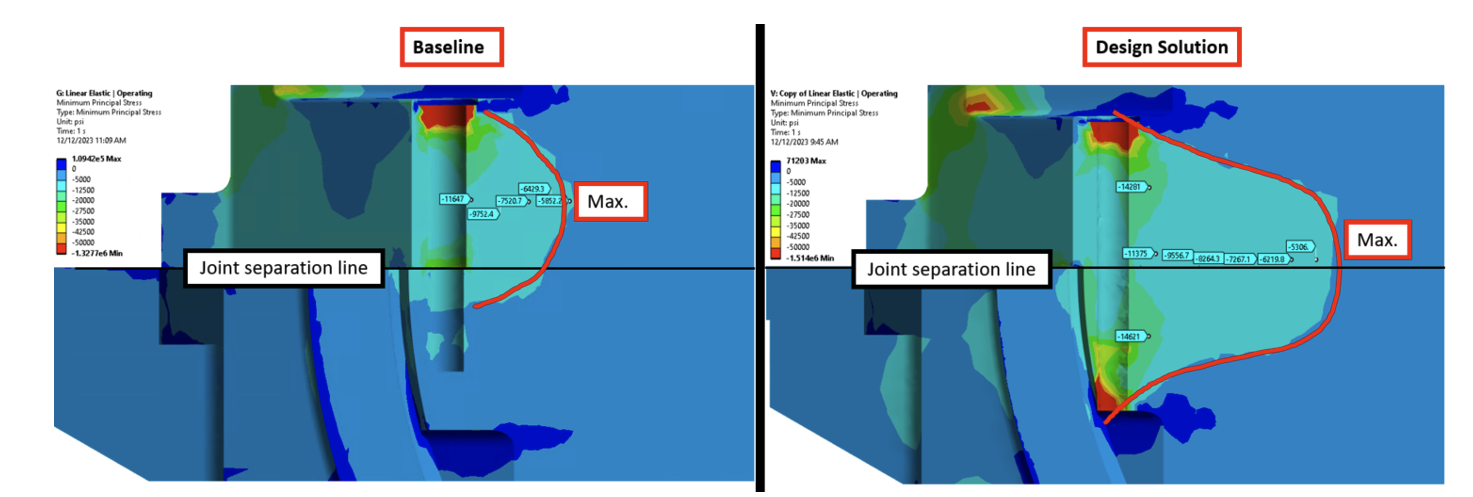
Figure 14: Section view through the flange joint showing the baseline stress results at assembly torque (left side) and the design solution stresses at assembly torque (right side).
To add a final layer of protection to the joint, an insulation jacket was added around the casing. The purpose of the jacket was to insulate the outer walls such that they would be held at a higher temperature, thus reducing the severity of the temperature gradient through the thickness of the walls. The results of the steady-state thermal model are shown in Figure 15. Once again, the left side of the figure shows the baseline casing results while the right side shows the results of the design solution. Finally, Figure 16 shows the resulting contact status from all of the design solutions described above. The result from the baseline casing is shown on the left while the design solution is shown on the right. The design solution showed a definite improvement in contact status as one could observe a majority of the flange face was “sticking”, indicating a significant reduction in the risk of joint leakage.
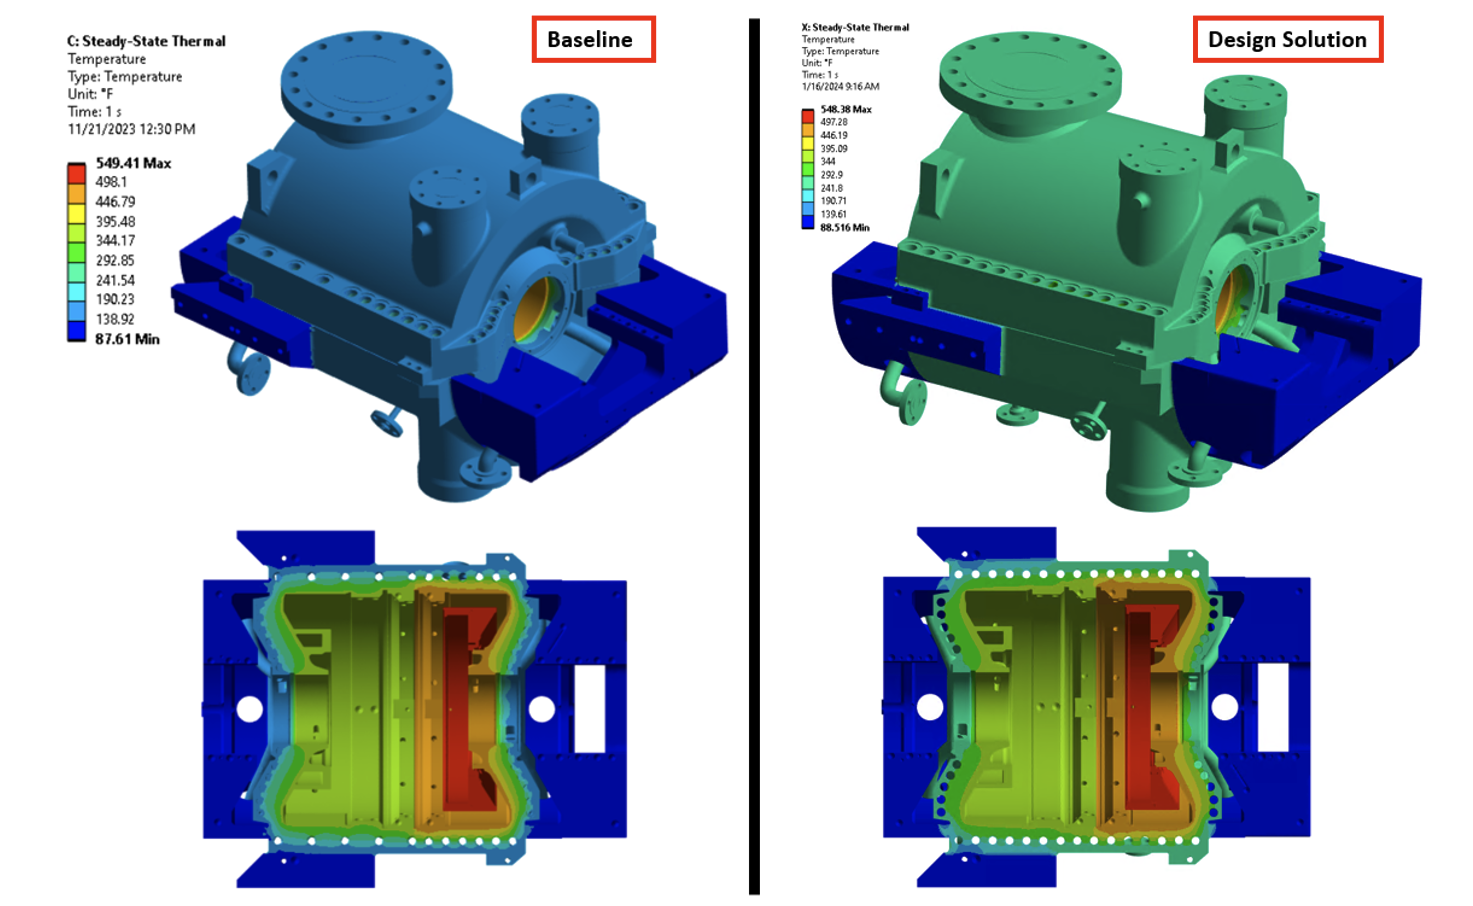
Figure 15: Section view through the flange joint showing the baseline stress results at assembly torque (left side) and the design solution stresses at assembly torque (right side).
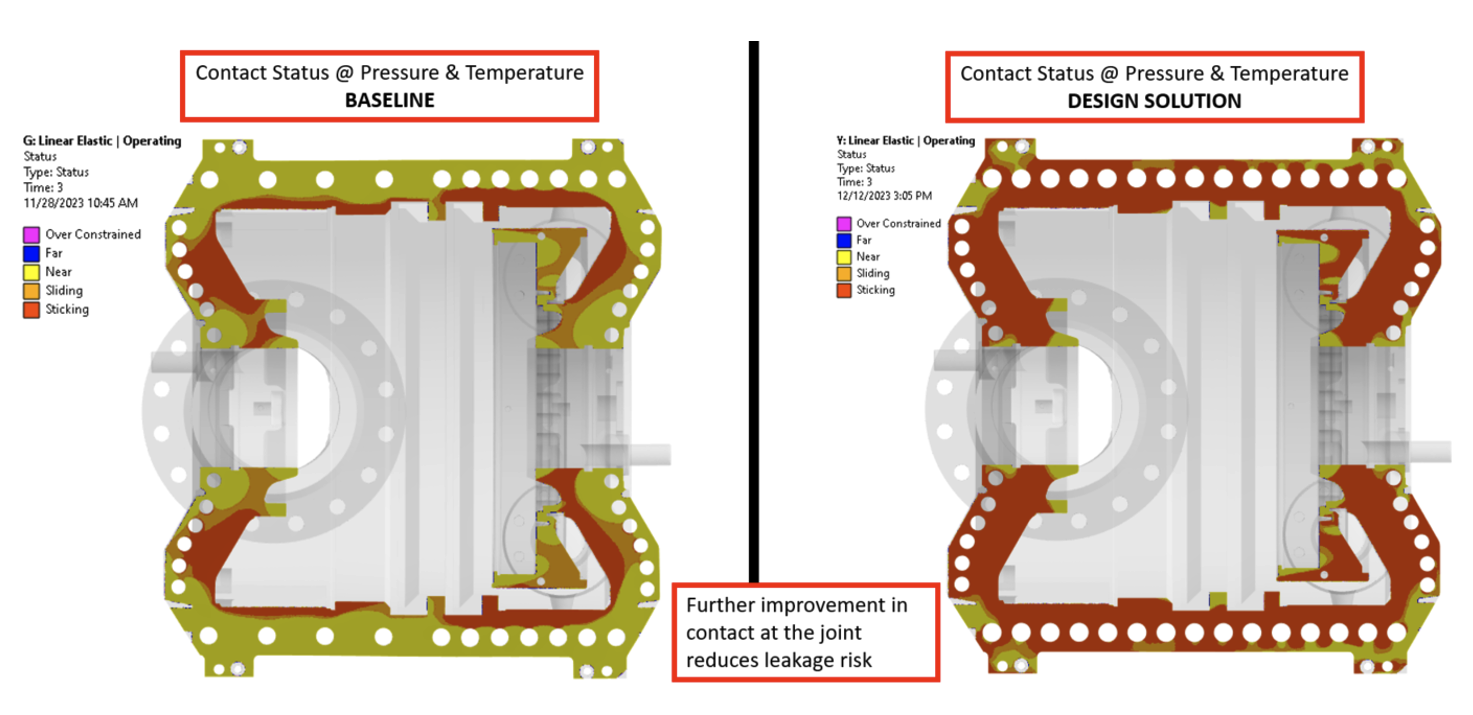
Figure 16: Contact status contours at the joint face for the baseline (left) and the design solution (right).
The result from Figure 16 above was a promising indication that the bulk of the design problems were resolved. However, good engineering practice required one final verification: the resulting stresses in the bolts and the joint with all of the design changes needed to remain within acceptable limits (below yield). For the final validation, the bolts needed to be modeled in detail, which would prove to be too impractical a computational task using the bulk model. Therefore, another innovative modeling practice was employed; sub-modeling. Sub-modeling involved taking a piece or “area of interest” in the bulk model, cutting it away/modeling it separately, and using the bulk model to inform the cut-away model at the cut boundaries. Figure 17 better describes this process, which shows the sub-model section cut away from the bulk model and the strains from the bulk model applied at the cut faces. The overall goal and purpose of the sub-model is to allow more detailed modeling of a smaller area, while not losing the overall physics from the larger bulk model (which in this case were critical to the behavior of the joint).
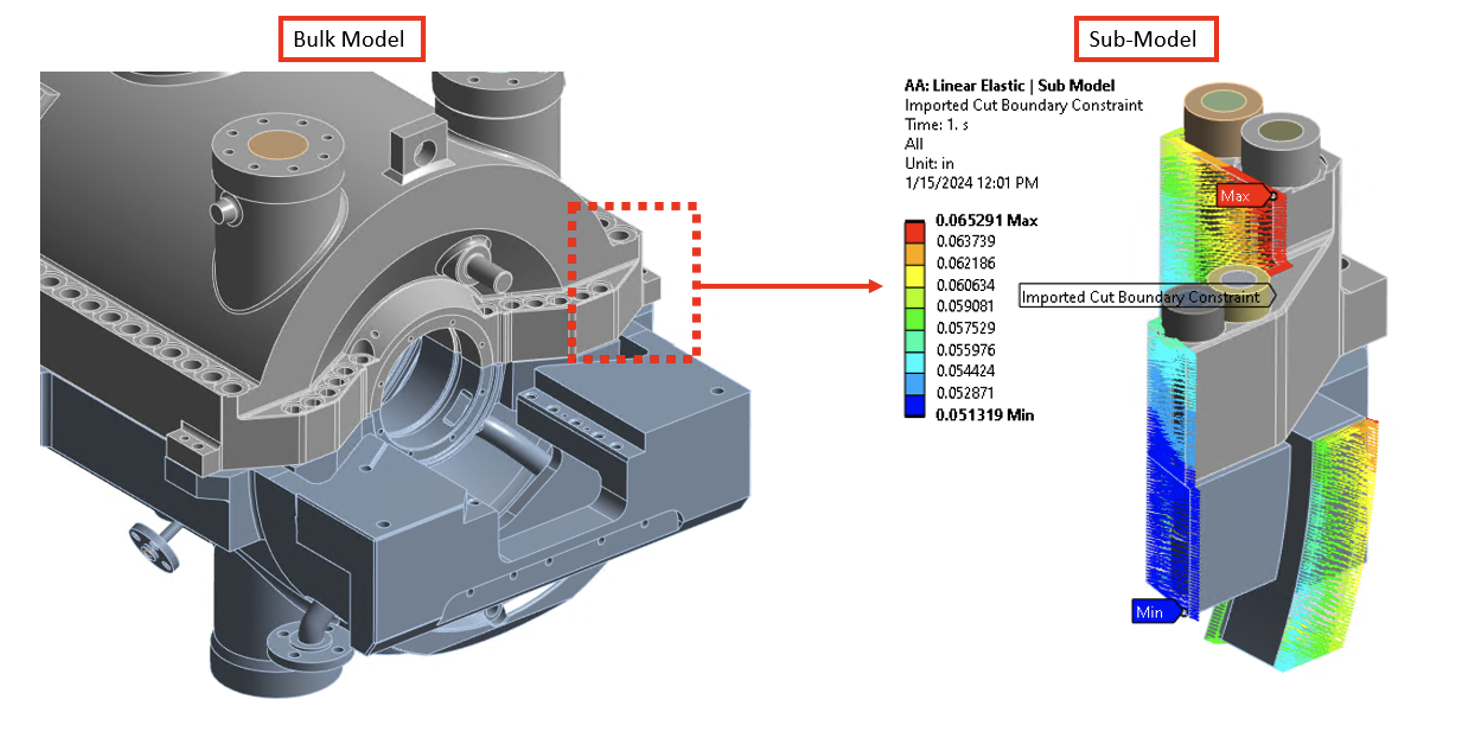
Figure 17: Sub-model (right) extracted from the bulk model (left) with strains from the bulk model applied at all cut faces.
The sub-model allowed for detailed stress modeling of the tensile areas of the bolts and the surrounding joint. The design engineer was able to gain insight into the distribution of stresses across the body of the bolts at full operating conditions (a task that was impossible using beam bolts in the bulk model). With this information, the design engineer was able to choose a safe material for the bolts that would ensure all of the tensile stresses in the bolts would remain below yield. The goal here was to ensure that bolts would remain in their elastic range and provide consistent clamping force (once bolts yield beyond a certain point, their ability to provide clamping force when tightened drops off severely as they permanently deform). Figure 18 below shows the stress results for some of the bolts and the information that was used to determine the required bolt material for adequate strength.
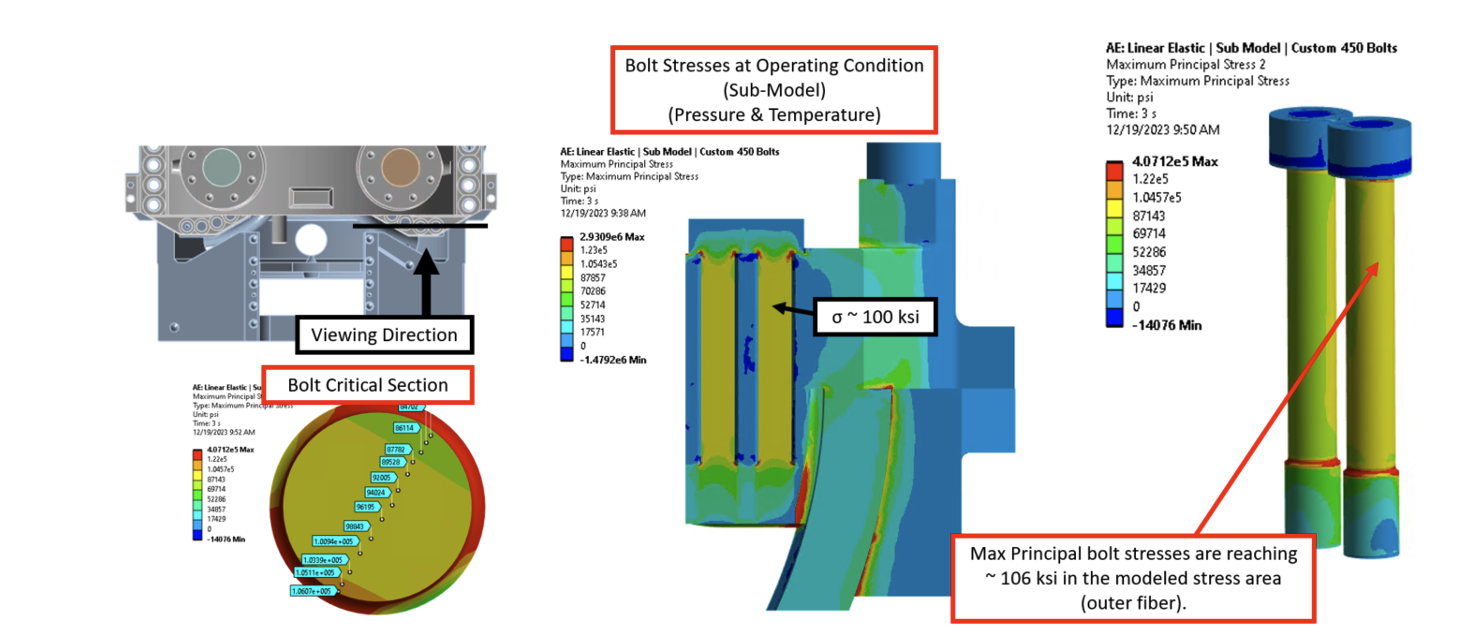
Figure 18: Sub-model (right) extracted from the bulk model (left) with strains from the bulk model applied at all cut faces.
Bolted joint design provides an interesting challenge for engineers. Many aspects of joint design are very well established and can be handled with relatively straightforward closed-form calculations. It often begs the question: Why go to the extent of modeling things in such detail and when is it ultimately necessary? It is true that in many aspects, simple “good practices” and the application of tried and true knowledge can lead to a robust joint design. However, the addition of certain operating conditions or physics can often take a simple engineering design and turn it into a much more complicated issue. As is the case with most engineering applications beyond bolted joint design: differential thermal expansion, complex geometric configurations, and highly 3-dimenional problems/boundary conditions can very quickly turn a simple close-form calculation into a complex partial differential equation best suited for finite element modeling. Design engineers give each problem and design challenge unique consideration to determine the best path forward. It is often the case that a combination of practical methods with advanced modeling techniques can provide a robust and innovative solution, along with a greatly enhanced understanding of the situation and physics at hand. While the development of a final solution is an interdisciplinary process that involves many steps upstream and downstream of engineering concept development, the design and analysis team are always an instrumental part of developing robust and innovative solutions at RMS.

